Capital Insights: How Nvidia's Success Distorts Our Understanding [June 2024]
Jun 21 2024 | Back to Blog List
VIDEO TRANSCRIPT:
Hi, I’m Trent Von Ahsen, partner with Cedar Point Capital Partners. Welcome to the June 2024 edition of Capital Insights!
This month, we’re taking a look at the one stock that’s accounted for roughly 33% of the S&P 500’s return so far this year, and how that compares with the other 500 constituents of the index.
We’re talking, of course, about NVIDIA - a leading semiconductor company in the AI space. It has grown quickly thanks to huge demand from clients like Microsoft and Amazon, and investors have taken notice. The stock has gained over 170% year to date and contributed to over a third of the S&P 500’s total return in 2024.
But how often does one company account for such a large portion of an index’s performance? Well—the answer is rarely—but don’t take my word for it, let’s take a look at the data.
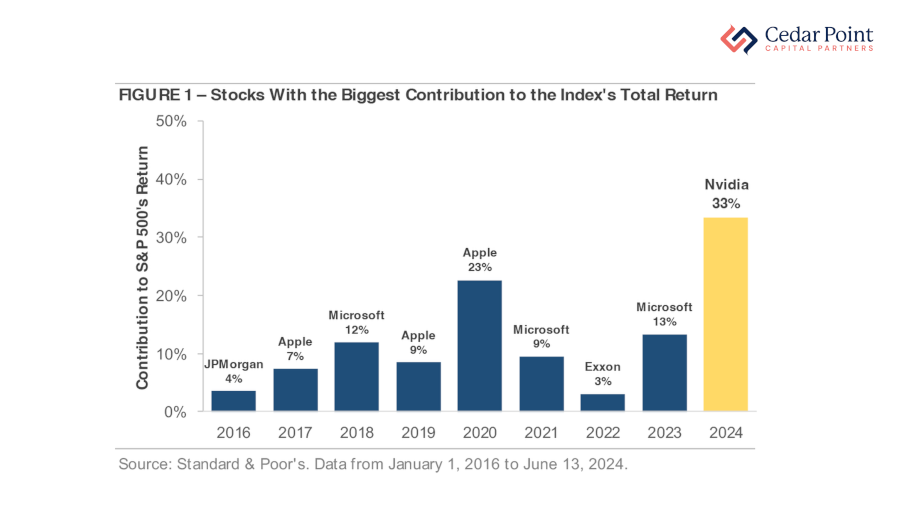
As you can see here in Figure 1, this chart shows the S&P 500 constituent company that contributed the most to the index’s return by year, going back to 2016.
Between 2016 and 2023, the most impactful stock contributed an average of one tenth of the index’s total return. The biggest previous contribution by a single stock, was in 2020, when Apple accounted for more than 23% of returns that year.
Indeed, Nvidia’s recent performance has been one for the history books—but it’s also a good reminder to look beyond the headlines when analyzing portfolio performance & diversification.
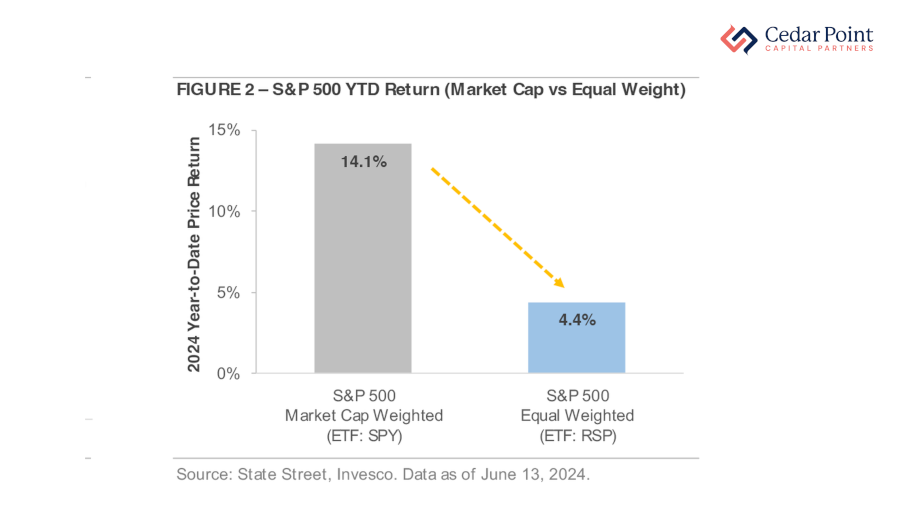
Here in Figure 2, we see how the S&P 500 Index would have performed if its holdings were weighted equally, rather than by market capitalization.
As of this recording in mid-June 2024, the market-cap weighted S&P 500 index has gained over 14%, while the equally-weighted version, has gained less than 5%.
This year's performance—with its concentrated mega-cap stock attribution—serves to show that headline index returns can overstate the average U.S. company’s performance and not necessarily tell the full story of the entire U.S. stock market.
If you have questions about this video or your portfolio, reach out and let’s start a conversation.
My name is Trent Von Ahsen, I look forward to seeing you right here next month for our latest edition of Capital Insights.
Stay curious, stay mindful of your goals, and we’ll see you next time.
The commentary on this blog reflects the personal opinions, viewpoints, and analyses of Cedar Point Capital Partners (CPCP) employees providing such comments and should not be regarded as a description of advisory services provided by CPCP or performance returns of any CPCP client. The views reflected in the commentary are subject to change at any time without notice. Nothing on this blog constitutes investment advice, performance data or any recommendation that any particular security, portfolio of securities, transaction, or investment strategy is suitable for any specific person. Any mention of a particular security and related performance data is not a recommendation to buy or sell that security. Cedar Point Capital Partners manages its clients’ accounts using a variety of investment techniques and strategies, which are not necessarily discussed in the commentary. Investments in securities involve the risk of loss. Past performance is no guarantee of future results.