Capital Insights: Riding the Equities Rollercoaster [August 2024]
Aug 20 2024 | Back to Blog List
VIDEO TRANSCRIPT:
Hi, I’m Trent Von Ahsen, partner with Cedar Point Capital Partners. Welcome to the August 2024 edition of Capital Insights!
This month, we’re continuing our look at the US Equity Market, but focusing on recent volatility and putting that into some helpful context.
As we’ve discussed previously, it has been a strong first half of the year for markets. The S&P 500 index gained more than 15% through June and set an all-time high on July 16th. However, since mid-July, we’ve seen mixed economic data points, primarily July’s Jobs Report, which showed unemployment rising to a 3-year high.
This report, compounded with foreign currency market related technical factors, spooked investors watching for a potential recession, and kickstarted a sell-off that lasted into mid-August. The S&P 500 index at one point sold off 8% below its most recent all-time high, and almost breached correction territory.
Now, if history provides anything – it is perspective. We can better frame this recent market volatility and typical drawdowns by looking at the historical data – so, let’s take a look at Figure 1.
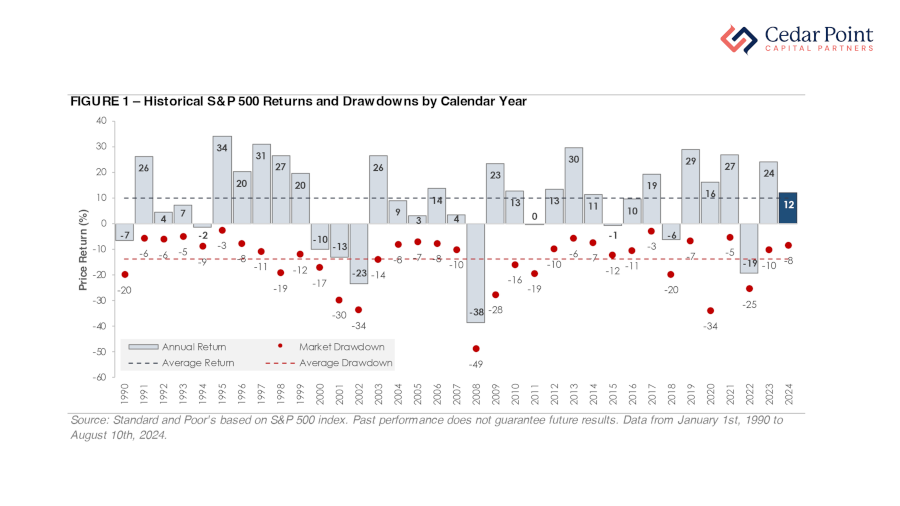
This chart tells the story, going back to 1990, of the S&P 500 index’s annual price returns and steepest intra-year drawdowns. The dashed navy line shows the index has produced an average annual return of nearly 10% over this time frame. The bottom half of the graph, however, shows a lot can happen within the market throughout the year.
Here, red dots show the S&P 500’s biggest intra-year decline for each year, with the dashed red line showing the average annual drawdown from January 1st, 1990, through August 10th of this year.
For further perspective, 32 of these 35 years have had an intra-year selloff of 5% or more. Nineteen of these years had a selloff of -10% or more, with six of the past 35 years experiencing an intra-year drawdown greater than 20%.
In summary, market volatility is the price of admission for investing. In the short term, markets move in both directions as data changes and investors adjust to new information. But in the long term, corporate earnings and economic growth drive market returns – and it’s a valuable reminder that investing with a long-term mindset is essential for meeting your financial and life goals.
If you have questions about this video or your portfolio, reach out and let’s start a conversation.
My name is Trent Von Ahsen, I look forward to seeing you right here next month for our latest edition of Capital Insights.
Stay curious, stay mindful of your goals, and we’ll see you next time.
The commentary on this blog reflects the personal opinions, viewpoints, and analyses of Cedar Point Capital Partners (CPCP) employees providing such comments and should not be regarded as a description of advisory services provided by CPCP or performance returns of any CPCP client. The views reflected in the commentary are subject to change at any time without notice. Nothing on this blog constitutes investment advice, performance data or any recommendation that any particular security, portfolio of securities, transaction, or investment strategy is suitable for any specific person. Any mention of a particular security and related performance data is not a recommendation to buy or sell that security. Cedar Point Capital Partners manages its clients’ accounts using a variety of investment techniques and strategies, which are not necessarily discussed in the commentary. Investments in securities involve the risk of loss. Past performance is no guarantee of future results.