Capital Insights: Uncharted Territory for the LEI [Oct. 2024]
Oct 22 2024 | Back to Blog List
VIDEO TRANSCRIPT:
Hi, I’m Trent Von Ahsen, Partner with Cedar Point Capital Partners. Welcome to the October 2024 edition of Capital Insights!
This month, we’re exploring the uncharted territory the US economy currently finds itself in, and some possible reasons for these associated poor economic signals.
This new territory comes in the form of The Conference Board Leading Economic Index, or, the LEI for short. It’s a closely watched gauge of future economic activity, comprised of 10 financial and non-financial components, and has become known as a reliable signal of where our economy is headed—or, at least, it used to be.

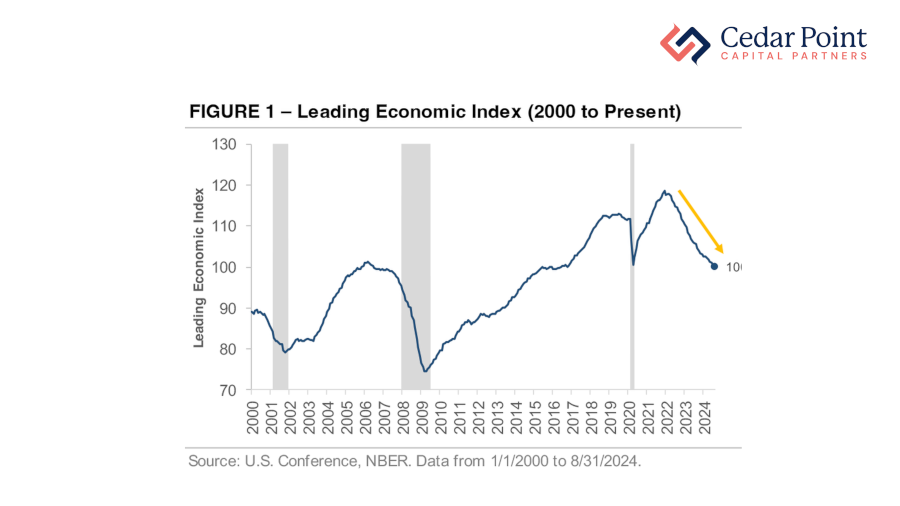
Here in Figure 1, we see the latest LEI data, going back to the year 2000. While it may go without mentioning, to confirm, a rising index signals improving economic conditions, and a falling index points toward worsening conditions and potential recession.
Now, by numerous accounts, the US economy is doing quite well. Unemployment is low, corporate earnings are on the rise, and inflation seems to be meandering toward the Federal Reserve’s target of 2%. But you can see that the LEI has been headed the other way since November of 2021. The index is now at its lowest point since 2016.
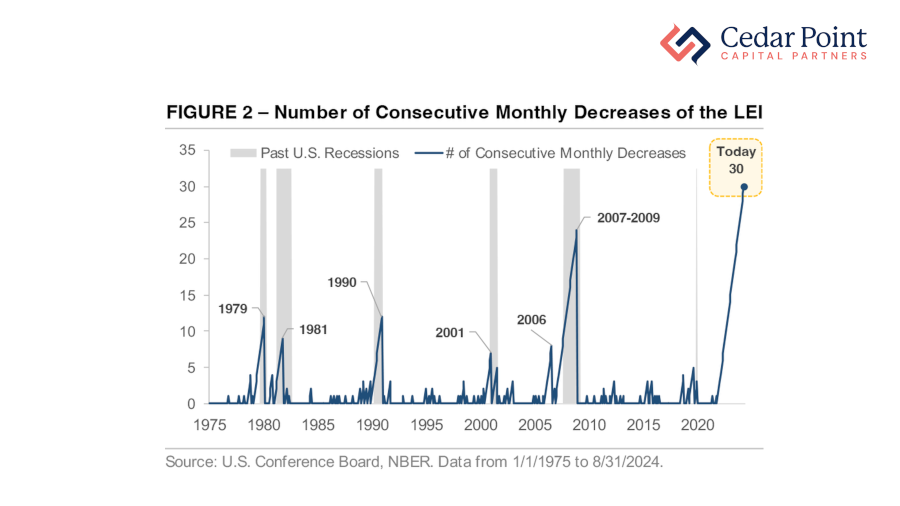
Historically speaking, when the LEI declines for several months, the economy is often entering or already in a recession—a relationship showcased in Figure 2.

As we can see from this chart, the index fell for 6 months before 2000’s tech bubble burst, and 10 months before the 2008 recession. But the latest data shows that the LEI has declined for 30 consecutive months—a figure we’ve never seen before in this data set. This suggests that economic growth should be slowing more than it is, and reinforces the idea that this economic cycle is fundamentally different from the rest.
But why is this? Well, the theory is that the pandemic spurred structural changes that continue to affect us today. For example, interest rates fell to near zero, allowing companies to access low-cost financing, while multiple rounds of fiscal stimulus changed how money flows through our financial system. Likewise, supply chains received a makeover during COVID, with many companies bringing production back to the United States.
The LEI’s recent trend does not mean the economy is broken – just that it’s different. What that signals for the future is unclear, but it is a reminder that even the most trustworthy leading indicators require deeper investigation.
If you have questions about this video or your portfolio, reach out and let’s start a conversation.
My name is Trent Von Ahsen, I look forward to seeing you right here next month for our latest edition of Capital Insights.
Stay curious, stay mindful of your goals, and we’ll see you next time.
The commentary on this blog reflects the personal opinions, viewpoints, and analyses of Cedar Point Capital Partners (CPCP) employees providing such comments and should not be regarded as a description of advisory services provided by CPCP or performance returns of any CPCP client. The views reflected in the commentary are subject to change at any time without notice. Nothing on this blog constitutes investment advice, performance data or any recommendation that any particular security, portfolio of securities, transaction, or investment strategy is suitable for any specific person. Any mention of a particular security and related performance data is not a recommendation to buy or sell that security. Cedar Point Capital Partners manages its clients’ accounts using a variety of investment techniques and strategies, which are not necessarily discussed in the commentary. Investments in securities involve the risk of loss. Past performance is no guarantee of future results.